SIEM Homelab with Azure Sentinel
To experiment and learn about the different aspects of defensive cybersecurity, I have created this Cybersecurity Home Lab to model detection and monitoring through Firewalls and SIEMs in a virtualized environment.
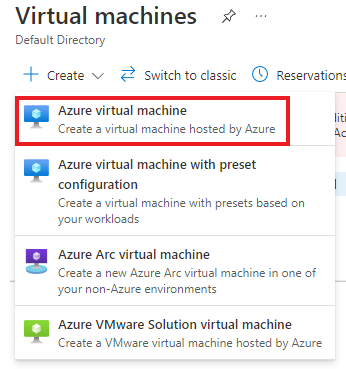
First we will be creating a virtual machine in Azure to serve as our honeypot machine that we will be collecting logs from.
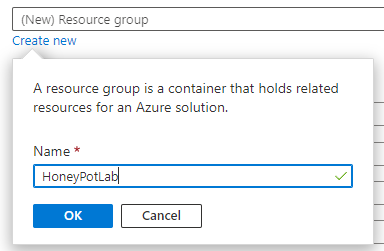
We created an Azure Virtual Machine named honeypotvm and assigned it to a resource group we created named HoneyPotLab.
A resource group is a collection of resources that share the same lifecycle, permissions and policies.
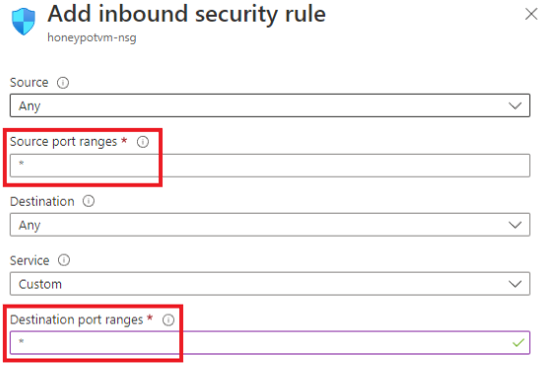
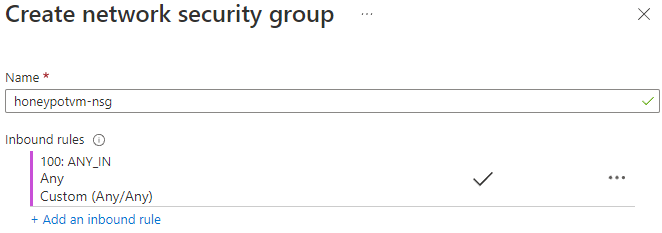
In order to allow any internet traffic from the internet to this VM, We have created and assigned a network security group to this VM with an Inbound rule that allows traffic from any source to any destination port on our VM.
The purpose of the Log Analytics Workspace in our lab is to ingest logs from our honeypotvm and have Azure Sentinel connect to this workspace to display geodata on the map.
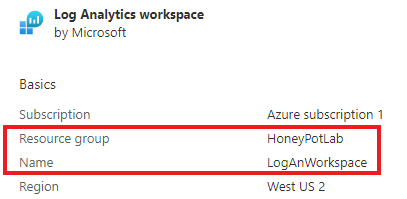
We created a Log Analytics Workspace named LogAnWorkspace and assigned our HoneyPotLab resource group we have created earlier.
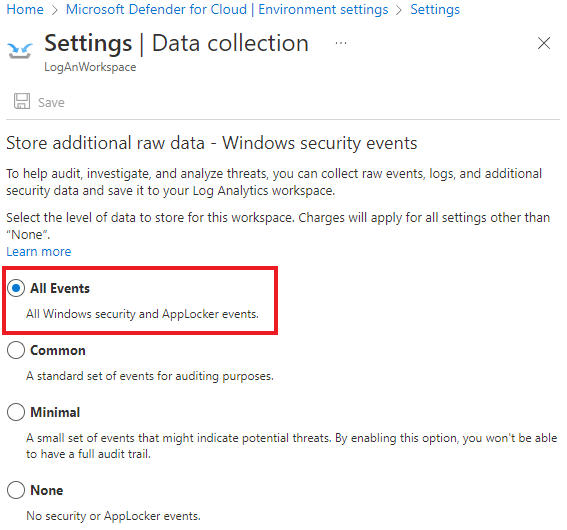
We also made changes within Microsoft Defender for Cloud in order to enable the ability to gather logs from our VM into the log analytics workspace. These changes include:
- Turning on Azure Defender
- Set the data collection setting to collect all windows security and applocker events.
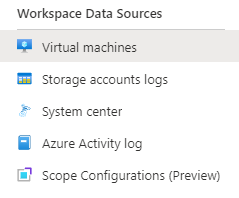
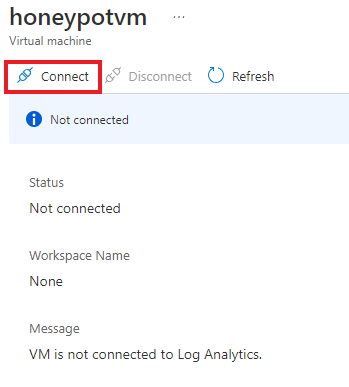
We then went back into out Log Analytics Workspace to connect our HoneyPotVM as a workspace data source.
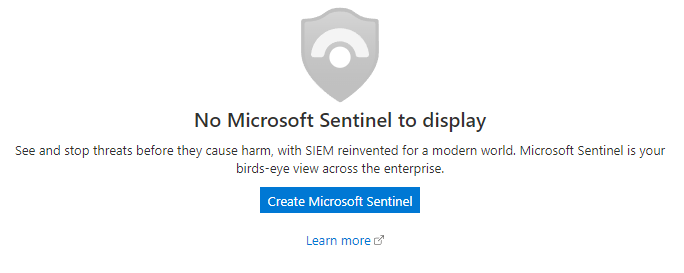
Azure Sentinel is the SIEM that we are going to use to visualize our attack data.
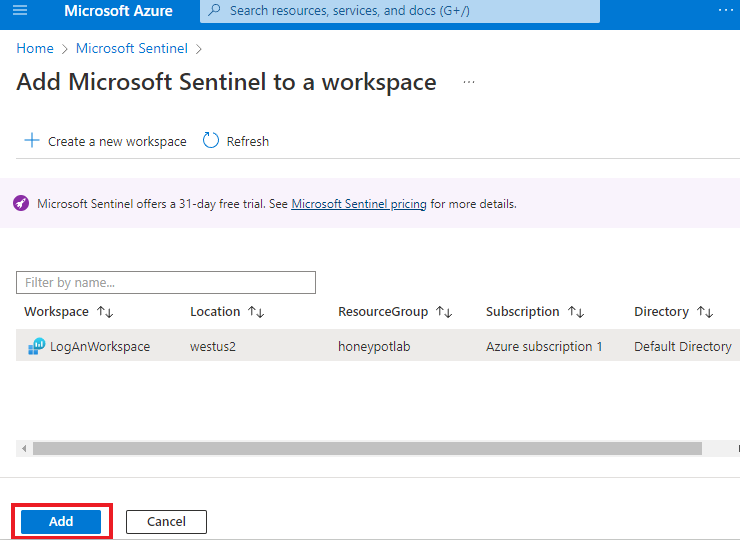
We simply add azure sentinal to our honeypot workspace
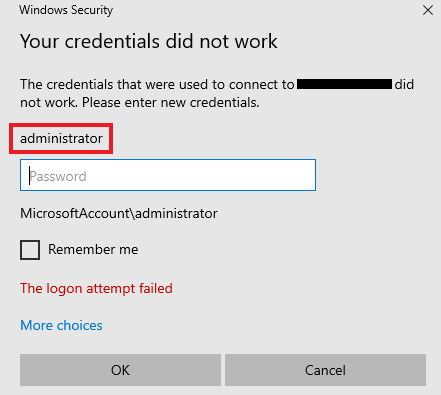
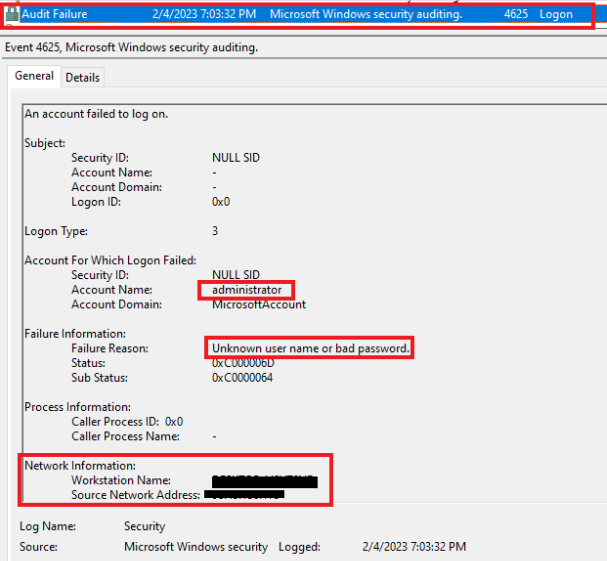
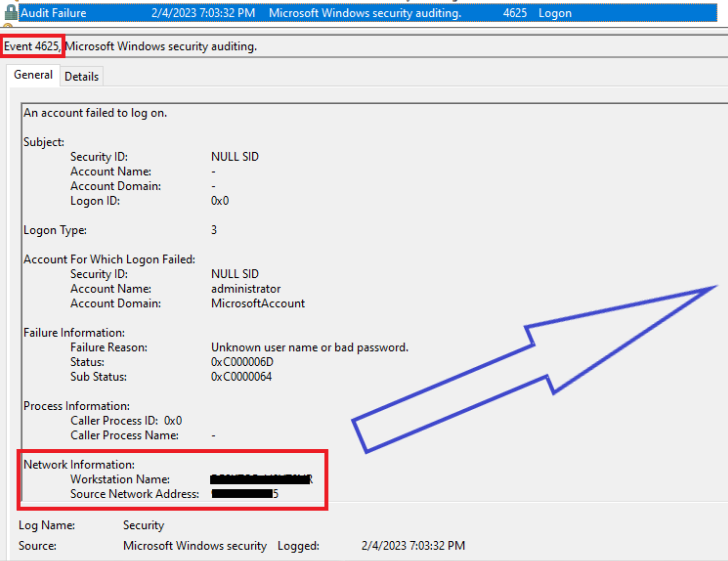
We have simulated what an windows event viewer security log would look like if there was a failed RDP attempt to our VM.
The event log collects important data such as the source network address, workstation name, and account name user was attempting to use to access our VM.
Using the data collected by Windows Event Viewer, we will use a script that will conduct the following:
1. Gather all failed RDP log on events from Windows Event Viewer (Event ID 4625)
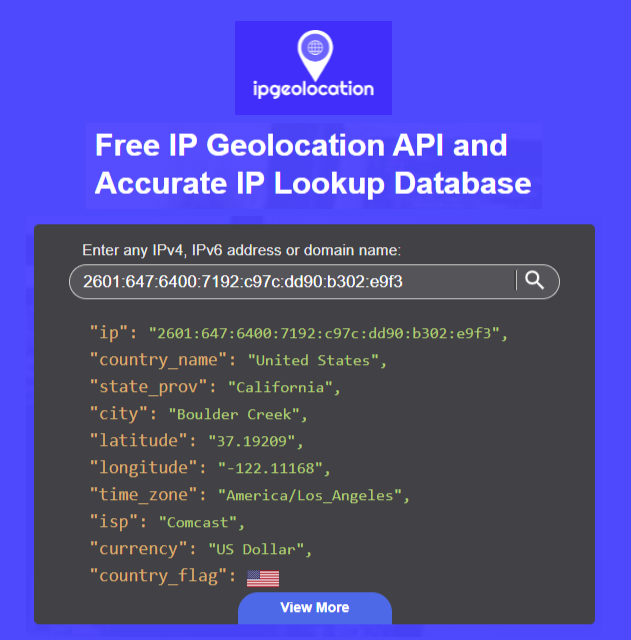
2. Grab IP address failed attempt events and sends to IPGeolocation API.
3. API to gather geolocation data from IP address; script will insert geolocation data into log file we have created on the virtual machine.
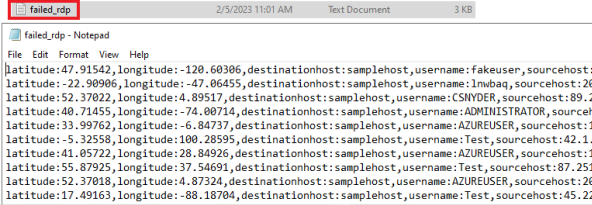
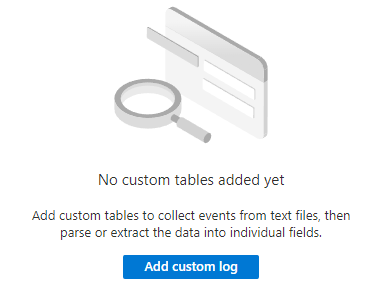
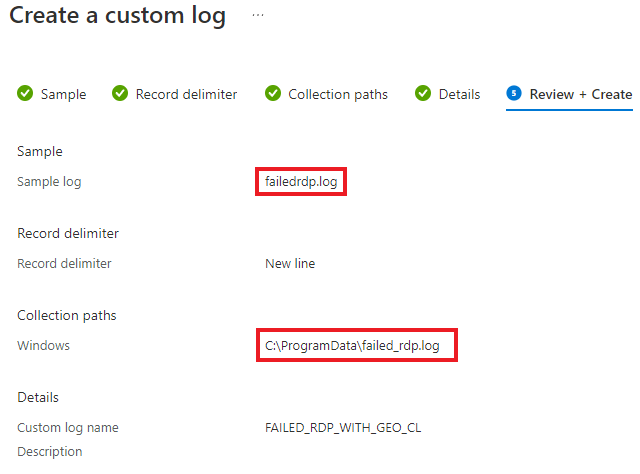
We have created a custom log in our log analytics workspace so that we are able to pull the custom geographic data from the logfile on our honeypot VM, out to the log analytics workspace we created in Azure.
Providing a sample log allows us to help log analytics workspace know what data we are looking for in this custom file. We have provided the log shown at our event log setup as a sample log.
The collection path is the path on our honeypotvm where the failed RDP log resides.
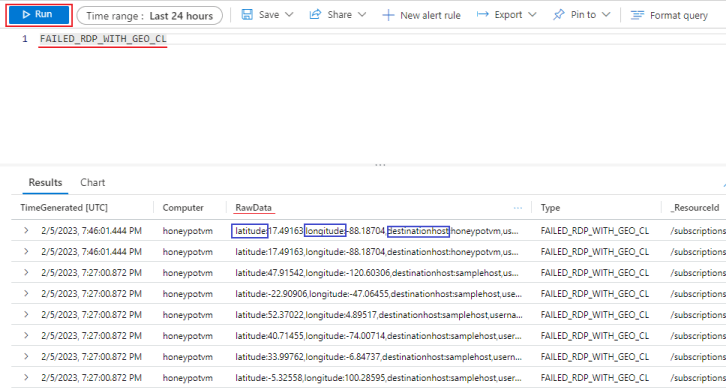
By running our custom log, we were able to pull data from our FailedRDP log file data on our honeypot workstation to the log analytics workspace we have created in azure.
Currently, Latitude, Longitude, Destination Host, Label, Source Host, Destination Host, State, Timestamp, and Username are all contained in the Raw Data Column.
To further distinguish our data we will be using the Extract Fields function to organize our data.
For each distinguished parts of raw data, we are going to highlight the part and assign it a field title. Like shown below, we have highlighted the latitude value within the raw data field of our log and assigned it a field title of Latitude_CF.
We then verify that the search results properly highlights the latitude from the fields from our sample log. Once verified correct, we select “save extraction” and repeat the steps for the remaining fields.
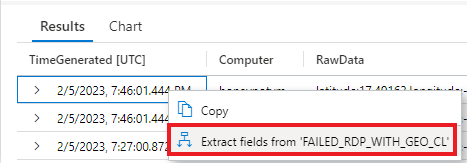
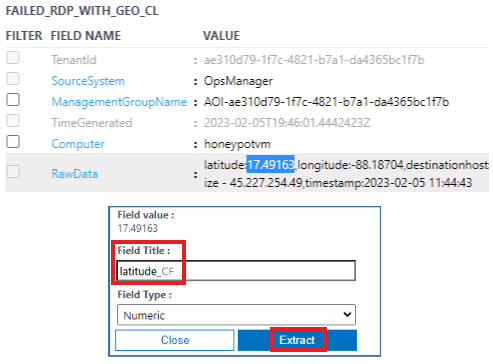
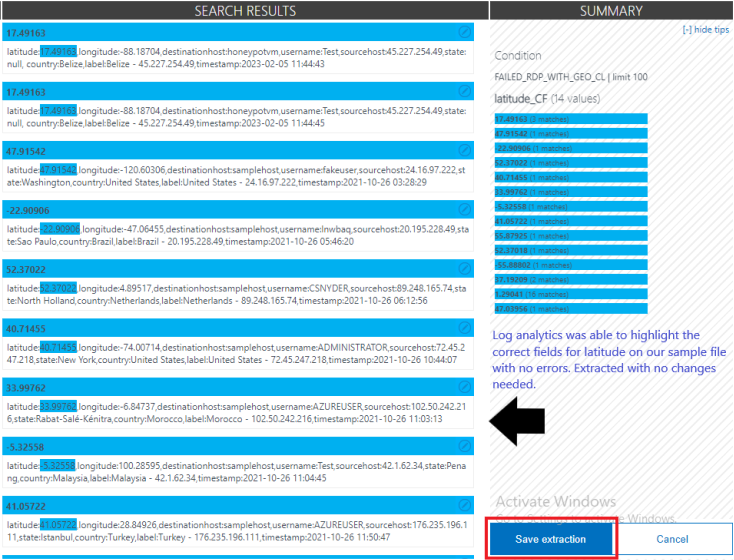
As shown above, we first highlighted the latitude value within the raw data field of our log and assigned it a field title of Latitude_CF. We then verify that the search results properly highlights the latitude from the fields from our sample log. Once verified correct, we select “save extraction”.
We are essentially “training” log analytics workspace on how to differentiate the categories within the raw data field.
We will continue to use the Extract Fields function for Longitude, Destination Host, Label, Source Host, Destination Host, State, Timestamp, and Username.
There will be instances where Log analytics will not highlight the correct data as you would like. When extracting for Longitude, we notice that log analytics highlighted the incorrect information in some entries.
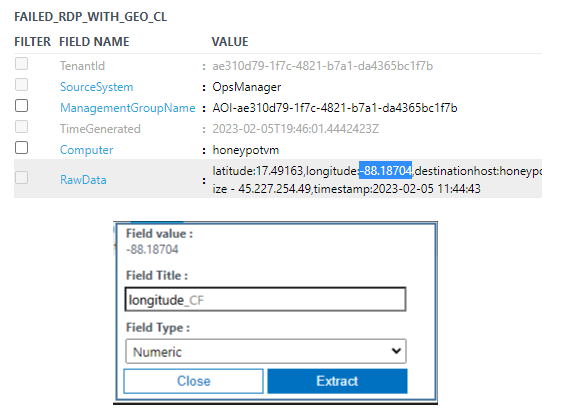


In the entry above, we see that the highlighted data was not the longitude but the IP address of the source host. For this we use the Modify this highlight feature to manually highlight the correct data for longitude in this field. As we make necessary corrections, Log analytics will continue to learn more about how to correctly highlight the fields you intend to be highlighted.
Once we’ve created all custom fields, any further collected logs will catalogiive into the custom fields we’ve created


Once we confirm that our custom log is now collecting a sorting data properly, we then created a new workbook within Azure Sentinel with a goal to to gather data from the custom log we created in our Log Analytics Workspace and plot the data on a map.
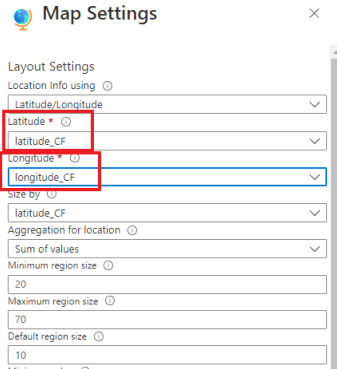
We have done this by creating a query referencing our custom log created in log analytics and made notes to exclude unnecessary data. Changing the visualization option to Map, we are able to configure our map settings to use our latitude and longitude data to plot points in the map where attackers are attempting to connect to our honeypot VM.

Just minutes after we were able to get failed RDP events from South Korea. We will leave our VM running overnight to see how much failed login attempts we receieve.
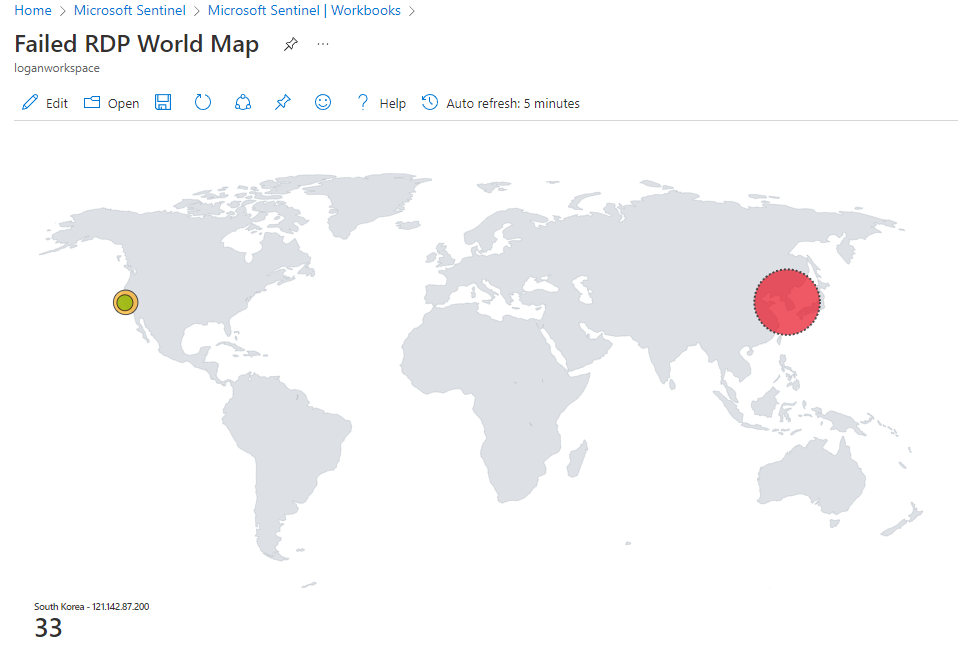
After 24 hours elapsed, we gotten over 10 thousand failed RDP attempts to our honeypot vm
